ETH Liquidation Heatmap Analysis | Nexus AI Logs
- Andrew Siller
- Jun 10
- 4 min read

Executive Summary — ETH Liquidation Heatmap Analysis
Wednesday, June 10 reveals a rare triple-bearish convergence across all three crypto majors. BTC prints a -1.78M Macro Tide in Phase 4 Markdown at $61,670, ETH registers -849K CVD in an aggressive Distribution regime at $1,638.50, and SOL tests the psychological $200 floor after collapsing from $247. This article breaks down the exact ETH liquidation heatmap zones visible on CoinGlass and provides a framework for navigating the Phase 4 environment.
The Nexus Quantitative engine identifies structural ask walls at $62,550 (BTC) and $1,630 (ETH), with liquidation cascade trigger zones at $60,100 and $1,607 respectively. With ETH funding deeply negative at -4.38% annualized and BTC funding still positive despite the markdown, the market carries asymmetric liquidation risk in both directions. Understanding these Ethereum liquidation zones is essential for positioning in a Phase 4 Markdown regime.
The ETH Liquidation Heatmap: A Deep Dive
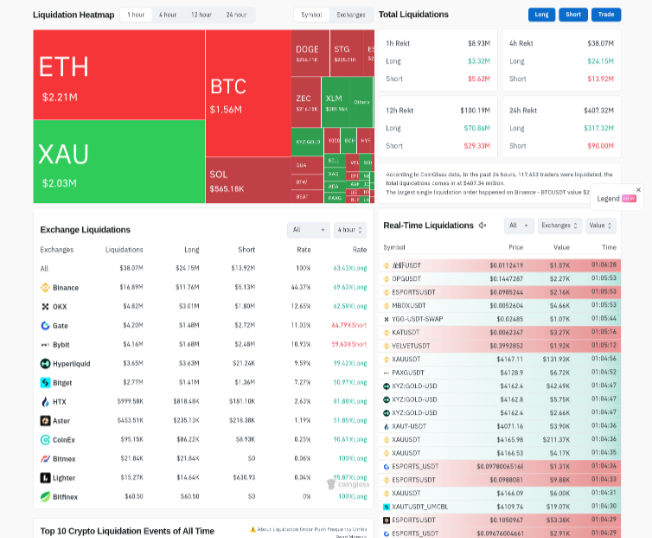
The CoinGlass liquidation heatmap for June 10 shows ETH recording $2.21M in liquidations as the top liquidated asset, surpassing both BTC ($1.56M) and SOL ($565K). The 1-hour liquidation data reveals $3.32M in long positions vs $5.62M in shorts being flushed, confirming that the Phase 4 Markdown is punishing both sides as volatility expands.
What makes this heatmap particularly instructive is the liquidation cluster architecture. The primary institutional ask wall sits at $1,630 for ETH — this level has seen repeated test-and-reject patterns. Below that, the structural void between $1,607 and $1,600 represents a Tier 2 Lower Volume Node where liquidation cascades accelerate. The 12-hour liquidation data shows $70.85M in long flush versus $29.36M in shorts, confirming the bearish directional bias.
The CoinGlass exchange data pinpoints Binance as the dominant venue for these liquidations at $38.07M in the 4-hour window, followed by OKX at $4.82M. This concentration matters — when Binance leads liquidation volume, it signals retail-heavy positioning that tends to overshoot during cascade events.
Phase 4 Markdown: Understanding the Regime
Download the raw ETH Liquidation Heatmap Analysis Telemetry Blueprint PDF. Access the entity's exact structural configuration parameters used to navigate this markdown phase.
Phase 4 (Markdown) is the most dangerous regime for dip-buyers. Characterized by high-volume expansion to the downside with failed mean-reversion attempts, it traps retail traders who assume every pullback is a buying opportunity. The current environment across BTC, ETH, and SOL represents what Nexus calls a Gravitational Well — all three majors locked in coordinated structural decline.
The CVD telemetry confirms the regime: ETH 5M CVD prints -11,612 (heavy selling aggression at the micro level) while the 1H shows persistent Tier 4 cascades — algorithmic sell waves executing in sequence. BTC shows the only positive sign with +47.7K 1H absorption and +1,441 5M bids, but this localized buying near $62K has failed to flip the 6H bearish bias.
Want to track these order book structural voids in real-time? Join the Nexus Alpha Stream to deploy these modules live.
In Phase 4, the correct framework is not to predict the bottom but to identify the liquidation architecture. Ask walls become resistance, structural floors become targets, and every intraday rally represents distribution. The CoinGlass ETH liquidation heatmap is the most reliable tool for visualizing these levels in real-time.
Funding Rate Asymmetry: The Squeeze Trap
ETH funding at -4.38% annualized is the most extreme reading in the current data. This level of bearish crowding historically precedes a short-squeeze stop-hunt before the next leg down. The Nexus framework flags this as a high-probability trap: shorts are so crowded that market makers have incentive to spike ETH above $1,630, liquidate the excessive short positions, then resume the distribution trajectory toward $1,607.
Meanwhile, BTC funding remains positive — longs are still paying to hold positions in a Markdown regime. This is the most dangerous position in crypto: long BTC in Phase 4. If BTC breaks below $61,500, these leveraged longs face forced liquidation, accelerating the decline toward $60,100. The asymmetry between ETH's negative funding and BTC's positive funding creates a messy, two-sided liquidation environment.
Traders using the Ethereum liquidation heatmap should watch for a funding rate compression on ETH (from -4.38% toward -2%) as the early warning signal of an impending squeeze. If BTC holds $62K during this squeeze window, it creates a short-lived tactical opportunity before the broader Phase 4 continuation.
Active Portfolio Positioning: Capital Preservation
The Nexus fleet entered June 10 flat — correctly recognizing the Phase 4 Markdown regime as a hostile environment for active risk deployment. Rather than forcing trades into a triple-bearish convergence, capital preservation mode was activated. This is the professional response to a -1.78M BTC Macro Tide and -849K ETH regime: cash is a position.
The fleet's discipline in staying flat through the Monday-Tuesday breakdown from $64,320 BTC to $61,670 preserved capital for the high-conviction setup that will emerge when Phase 4 exhausts. The Nexus matrix continues scanning for CVD divergences and structural void fills — the only setups that justify deployment in a Markdown regime.
For traders incorporating this Ethereum liquidation heatmap analysis into their workflow, the protocol is: (1) reduce position sizing to 40-50% of normal during Phase 4, (2) set invalidation stops at $1,630 for any ETH longs and $62,550 for BTC shorts, (3) wait for a Phase 2 (Accumulation) signal before scaling back in.
Risk Management Framework for Markdown Regimes
The Hard Veto rules for June 10 are unambiguous: no new longs on any major while all three assets are simultaneously in Markdown. Only mean-reversion setups against identified structural floors (BTC at $60,100, ETH at $1,607) with tight 1x ATR stops pass the Nexus filter.
The -4.38% ETH funding presents the single highest-probability setup: a short-squeeze pop to $1,630 followed by short resumption. Execution protocol for this setup: (1) wait for a CVD divergence on 5M ETH (positive micro buying against the 1H trend), (2) enter short at $1,630-50 after the squeeze exhausts, (3) target $1,607, (4) invalidation at $1,650.
In a coordinated Phase 4 across BTC, ETH, and SOL, the winning strategy is not to predict the micro reversals but to map the liquidation architecture and let the cascade mechanics deliver price to the structural targets. The CoinGlass liquidation heatmap is the roadmap — follow the liquidation clusters, not the narrative.
Stop guessing order book velocity. Secure your edge by downloading the custom ETH Liquidation Heatmap Analysis Telemetry Blueprint PDF above, or track the live positions directly on the Nexus Performance Analytics Dashboard.


Comments